
Aviation accounts for around 2.5% of global CO2 emissions, but its overall contribution to climate change is higher, closer to 3.5%. Aviation emits 11.6% of the total emissions from transport, which collectively account for 24% of all CO2 contributions to the atmosphere.

Figure 1 – Global CO2 Emissions from Transport
This is because air travel emits CO2 plus other gasses and pollutants including NO (nitrous oxide), water vapor, SO2 sulfur dioxide (SO2) and soot.
Combined, they all result in a long term increase of CO2, a short-term increase but long-term decrease in ozone (O3); a decrease in methane (CH4); an increase in water vapor, and an increase in sulfur aerosols which affect both high-level and low-level clouds.
While some of these impacts result in warming and others create cooling, overall, the warming effect is stronger. CO2 causes ~34% of the warming. The remaining ~66% or the warming is caused by Contrails – water vapor trails from aircraft exhausts, nitrous oxides, and sulfate aerosols (i.e. the combination of soot+sulfur).
Taken together they create the effective radiative forcing (ERF) in the atmosphere caused by the Aviation sector.
ERF is the imbalance in the Earth-atmosphere energy system since pre-industrial times and is measured in Watts per Square Meter. It is used as a metric of climate change to enable comparisons between different greenhouse gasses and other impacts that affect the climate system – e.g. such as a change in albedo as that has an approximately linear relationship with global average surface temperature change.) Radiative forcing (RF) can be both Positive and Negative.
Using historical data, it is estimated that the total historical cumulative emissions by Aviation of CO2 amount to ~32.6bn tons since 1940. Nearly 50% of the 32.6bn tons was emitted over the past 20 years.
Given the high demand for commercial air transportation the amount of carbon release is expected to increase, especially once the Covid-19 Pandemic starts retreating into history.
The Intergovernmental Panel on Climate Change (IPCC) has stated that “Reaching and sustaining net-zero global anthropogenic CO2 emissions and declining net non-CO2 radiative forcing will halt anthropogenic global warming on multi-decadal time scales.” [1]IPCC Web Site Both conditions will have to be met to halt global warming.
To halt aviation’s contribution to global warming, aviation will need to achieve net-zero CO2 emissions and declining non-CO2 radiative forcings. Neither condition is sufficient alone. It will not be possible to offset continued warming from CO2 by varying non-CO2 radiative forcing, or vice versa, over multi-decade timescales.
To address aviation’s climate impacts, it is necessary to understand that emissions from aircraft jet engines have direct and indirect impacts on the climate. Figure 2 shows this in detail.

Figure 2 – How do aircraft emissions lead to climate change – from Carbon Brief
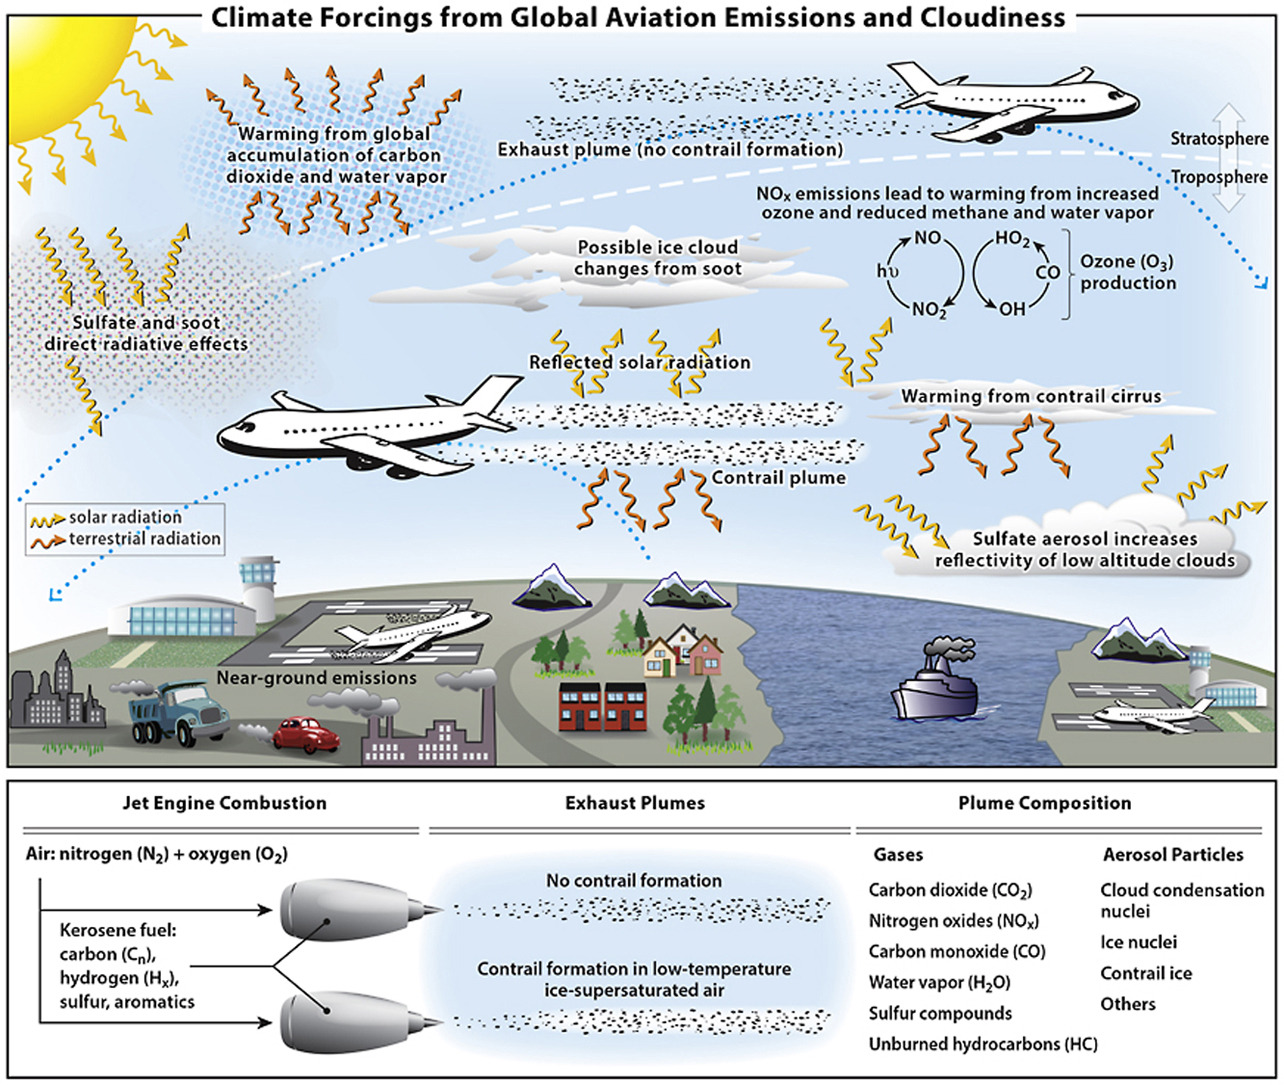
Figure 3 shows the processes by which aviation emissions cause increased cirrus cloudiness and affect the climate system. Positive RF (warming) contributions arise from an increase in CO2, water vapor, NOx, and soot emissions. These form contrail cirrus i.e consisting of linear contrails and the cirrus cloudiness arising from them. Negative RF (cooling) contributions arise from sulfate aerosol production.
Net warming from NOx emissions is the sum of warming (short-term ozone increase) and cooling (decreases in methane and stratospheric water vapor, and a long-term decrease in ozone). Net warming from contrail cirrus is a sum over the day/night cycle. These contributions involve a large number of chemical, microphysical, transport and radiative processes in the global atmosphere.

Figure 3 – Climate forcings from global aviation emissions and cloudiness – Carbon Brief
Researchers David Lee and colleagues reconstructed annual CO2 emissions from global aviation dating back to 1940. [2]Our World In Data This was calculated based on fuel consumption data from the International Energy Agency (IEA), and earlier estimates from Robert Sausen and Ulrich Schumann (2000).[3]Lee, D. S., Fahey, D. W., Skowron, A., Allen, M. R., Burkhardt, U., Chen, Q., … & Gettelman, A. (2020). The contribution of global aviation to anthropogenic climate forcing for 2000 to 2018. … Continue reading
Lee’s research concluded that global aviation (including domestic and international; passenger and freight) accounts for:
- 1.9% of greenhouse gas emissions (which includes all greenhouse gasses, not only CO2) – CY 2016.
- 2.5% of total CO2 emissions in 2018 (1.04 billion tons) – CY 2018.[4]Sausen, R., & Schumann, U. (2000). Estimates of the climate response to aircraft CO2 and NOx emissions scenarios. Climatic Change, 44(1-2), 27-58. The Global Carbon Budget estimated total CO2 … Continue reading
- 3.5% of ‘effective radiative forcing’ – a closer measure of its impact on warming – CY 2018.
Figure 4 shows the time series of global emissions from aviation since 1940. In 2018, it’s estimated that global aviation – which includes both passenger and freight – emitted 1.04 billion tons of CO2. Although aviation emissions have doubled since the mid-1980s they’ve been growing at a similar rate as total CO2 emissions – this means Aviation’s share of global emissions has been relatively stable and in the range of 2% to 2.5% of (actual) total CO2 emissions.[5]Global Carbon Project. (2019). Supplemental data of Global Carbon Budget 2019 (Version 1.0) [Data set]. Global Carbon Project. https://doi.org/10.18160/gcp-2019. If we were to exclude land use change … Continue reading

Figure 4 – Time Series of Global Aviation CO2 Contribution to the Atmosphere
David Lee et al. (2020) also quantified the overall effect of aviation on global warming when all of these impacts were included.[6]Lee, D. S., Fahey, D. W., Skowron, A., Allen, M. R., Burkhardt, U., Chen, Q., … & Gettelman, A. (2020). The contribution of global aviation to anthropogenic climate forcing for 2000 to 2018. … Continue reading To do this he and his colleagues calculated the so-called ‘Radiative Forcing’.
Radiative forcing measures the difference between incoming energy and the energy radiated back to space. If more energy is absorbed than radiated, the atmosphere becomes warmer.
Figure 5 shows their estimates for the radiative forcing of the different elements. When combined, aviation accounts for approximately 3.5% of effective radiative forcing: that is, 3.5% of warming.
Although CO2 gets most of the attention, it accounts for less than half of this warming. Two-thirds (66%) comes from non-CO2 forcings. Contrails – water vapor trails from aircraft exhausts – account for the largest share.
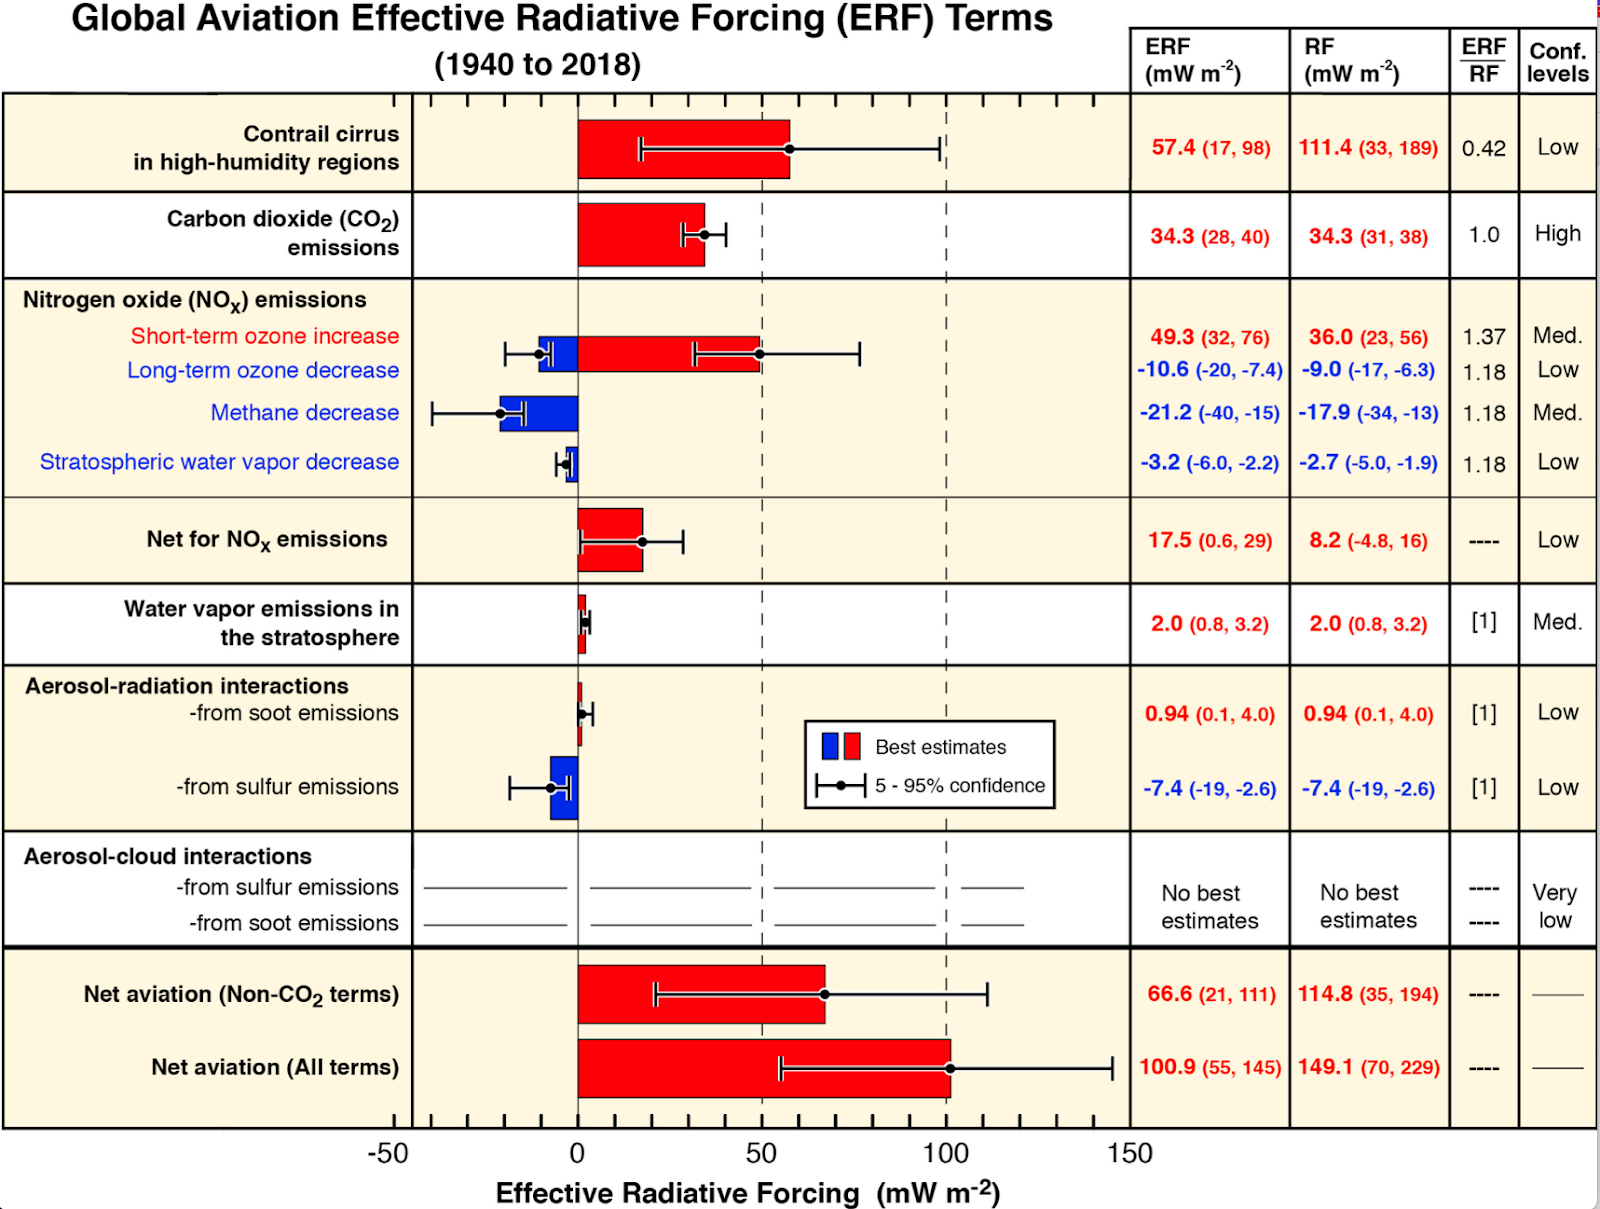
Figure 5 – Global Aviation Effective Radiative Forcing Terms into the Atmosphere
How do Global Aviation Emissions Break Down in Terms of Flight Distance Travelled?
Figure 6 gives the answer using data sourced from the 2019 International Council on Clean Transportation (ICCT) report on global aviation.[7]Graver, B., Zhang, K., & Rutherford, D. (2019). CO2 emissions from commercial aviation, 2018. The International Council of Clean Transportation.
- Most emissions come from passenger flights – in 2018, they accounted for 81% of aviation’s emissions; the remaining 19% came from freight, the transport of goods.
- Sixty percent (60%) of emissions from passenger flights come from international travel
- Forty percent (40%) come from domestic (in-country) flights.
When we break passenger flight emissions down by travel distance, we get a (surprisingly) equal three-way split in emissions between short-haul (less than 1,500 kilometers); medium-haul (1,500 to 4,000 km); and long-haul (greater than 4,000 km) journeys.

Figure 6 – Global CO2 Emissions from Commercial Aviation
The global inequalities in how much people fly become very evident when we compare aviation emissions across countries of different income levels. The ICCT split these emissions based on the World Bank’s four income groups.
A further study by Susanne Becek and Paresh Pant (2019) compared the contribution of each income group to global air travel emissions versus its share of world population.[8]Becken, S. and P. Pant (2019). Airline initiatives to reduce climate impact: ways to accelerate action (White paper). This comparison is shown in the visualization figure 7.
Note that this is based on categorisations from the average income level of countries, and does not take account of variation in income within countries. If we were to look at this distribution based on the income level of individuals rather than countries, the inequality in aviation emissions would be even larger
The ‘richest’ half of the world (high and upper-middle income countries) are responsible for 90% of air travel emissions.
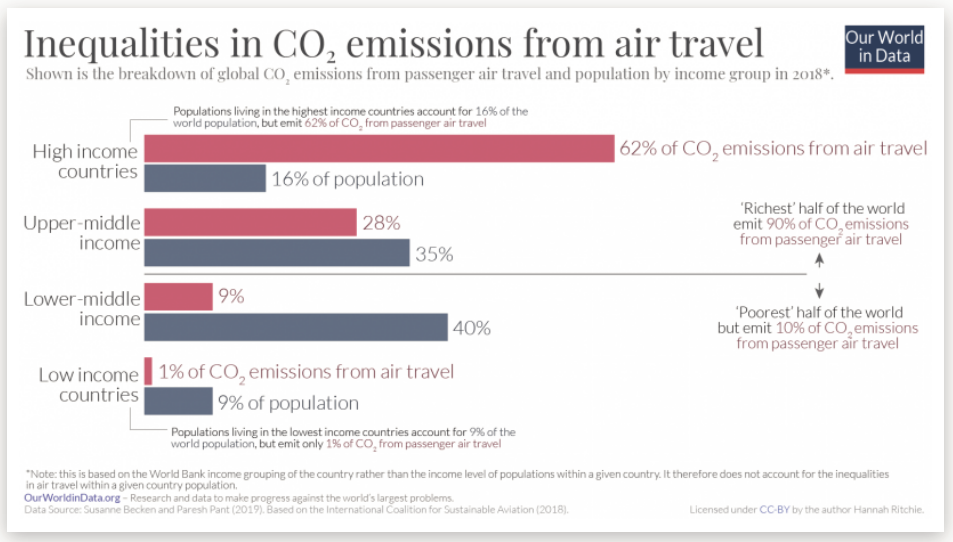
Figure 7 – Inequalities in CO2 emissions from air travel 2019
Looking at specific income groups:
- Only 16% of the world population live in high-income countries yet the planes that take off in those countries account for almost two-thirds (62%) of passenger emissions;
- Upper-middle income countries are home to 35% of the world population, and contribute 28% of emissions;
- Lower-middle income countries are home to the largest share (40% of the world), yet the planes taking off from there just account for 9% of emissions;
- The poorest countries – which are home to 9% of the world population – emit just 1%.
There is a Lack of Consensus on How to Attribute Aviation Related Carbon Emissions.
Flying is also a highly controversial topic in climate debates. Some reasons for this are as follows:
- The first is the disconnect between its role in our personal and collective carbon emissions. Air travel dominates a frequent traveler’s individual contribution to climate change. Yet aviation overall accounts for only 2.5% of global carbon dioxide (CO2) emissions. This is because there are large inequalities in how much people fly – many do not, or cannot afford to, fly at all [best estimates put this figure at around 80% of the world population.
- The second is how aviation emissions are attributed to countries. CO2 emissions from domestic flights are counted in a country’s emission accounts. International flight carbon emissions are not counted in a country’s carbon account – instead they are counted as their own category: ‘bunker fuels’. The fact that they don’t count towards the emissions of any country means there are few incentives for countries to reduce them.
It’s also important to note that unlike the most common greenhouse gasses – carbon dioxide, methane or nitrous oxide – non-CO2 forcings from aviation are not included in the Paris Agreement. This means they can be easily overlooked – especially since international aviation is not counted within any country’s emissions inventories or targets.
How Do We Accelerate The Transition To Carbon Free Flight
In 2009 the aviation industry set ambitious targets that include carbon-neutral growth from 2020 onward and halving its net emissions from 2005 levels by 2050. McKinsey recently developed a set of 1.5°C scenarios that would see reductions in aviation emissions of 18 to 35 percent compared with a business-as-usual pathway by 2030.
Further, as the energy and transportation industries create a path to decarbonize as a whole the Aviation sector will come under increasing pressure.
Since 1950, aviation emissions increased almost seven-fold; since 1960 they’ve tripled. Air traffic volume – here defined as revenue passenger kilometers (RPK) traveled, in the same time-frame, has increased by orders of magnitude more: almost 300-fold since 1950; and 75-fold since 1960.
The global passenger load factor has also increased from 61% in 1950 to 82% in 2018.
However, the Much Slower growth in Emissions Means Aviation Efficiency Improved Massively.
Figure 8 shows both the increase in global airline traffic since 1950, and aviation efficiency, measured as the quantity of CO2 emitted per revenue passenger kilometer traveled (RPK). In 2018, approximately 125 grams of CO2 were emitted per RPK. [9]Airline traffic data comes from the International Civil Aviation Organization (ICAO) via Airlines for America. Revenue passenger kilometers (RPK) measures the number of paying passengers multiplied … Continue reading
In 1960, this was eleven-fold higher; and in 1950 it was twenty-fold higher. It is clear that Aviation has seen massive efficiency improvements over the past 50 years.
These improvements have come from several sources: improvements in the design and technology of aircraft; larger aircraft sizes (allowing for more passengers per flight); and an increase in how ‘full’ passenger flights are. This last metric is termed the ‘passenger load factor’.
The passenger load factor measures the actual number of kilometers traveled by paying customers (RPK) as a percentage of the available seat kilometers (ASK) – the kilometers traveled if every plane was full.
If every plane was full the passenger load factor would be 100%.
If only three-quarters of the seats were filled, it would be 75%.

Figure 8 – Global Airline Traffic and Aviation’s Increasing Efficiency

Figure 9 – Global Airlines Ever Increasing Passenger Load Factor

Figure 10 – Global Airline Passenger Capacity & Traffic
Conclusion
Governments, research institutions and organizations encompassing the aerospace and aviation sectors have invested and continue to invest billions in R&D and fleet renewals to make aircraft more efficient. This has resulted in aircraft efficiency improving ~1% per year for many decades.
This is a huge achievement – aircraft today are far more fuel efficient than they have ever been, enabled by high bypass ratio gas turbines, composite aerostructures, and advanced airline operations.
However, once we are past the COVID crisis the aviation sector will return to growth far in excess of ~1% per year. This will result in emissions continuing to grow in the long-term. Without intervention the aviation’s emissions are expected to triple by 2050.
At the same time, the industry has set itself a target to reduce emissions to half of 2005 levels by 2050. To meet this target and decarbonize, aviation will need to adopt revolutionary measures. These include:
- Sustainable Aviation Fuels (SAFs) will play a crucial role between now and 2050.
- Electrical Propulsion; and
- Hydrogen Fuels
We have solutions to reduce emissions for many of the largest emitters – such as power or road transport – and it’s now a matter of scaling them. We can deploy renewable and nuclear energy technologies, and transition to electric cars. But we don’t have proven solutions to tackle aviation yet.
To accelerate the transition of flight to a carbon free era a broad coalition of public and private organizations are engaged in developing advanced technologies, policies, and standards that will help reduce/eliminate carbon emissions from commercial aviation.
These include venture/private equity backed start-ups, engine and aircraft manufacturers, academia, the National Aeronautics and Space Administration (NASA), the Federal Aviation Administration, the Environmental Protection Agency, and the U.S. Departments of Agriculture, Commerce, Defense, and Energy, as well as numerous multinational companies and organizations.
Even though significant progress has been made in many areas to make carbon free aviation a reality the pace of advancement is still slow. This is due to a variety of factors including the complexity of the technical problems that need to be solved, government certification processes, and the required transformation of manufacturing processes and systems.
The road to carbon free aviation will involve multiple strategies and technologies, all working in concert. Urban air mobility and short to medium haul flights will most likely lead the way with all electric solutions, while medium haul flights will (most likely) use a hybrid hydrogen+electric approach, and long haul international flights leveraging sustainable aviation fuels. Specifically:
- The increasing adoption of Sustainable Aviation Fuels (SAFs) will play an essential part in achieving the goal of a carbon free aviation sector.
- Emerging design concepts from Airbus, for example, have announced plans to have the first zero-emission aircraft by 2035, using hydrogen fuel cells.
- Tesla keeps hinting at a possible electric aircraft for short to medium haul flights.
- Several companies are in the test flight and regulatory approval phase for all electric short to medium haul aircraft.
- Multiple players in the urban air mobility space e.g. Joby, Archer etc. are in the test flight and certification phase for all electric VTOLs. These could (possibly) also have a positive impact on reducing carbon contribution by reducing the amount of CO2 emitted by reducing conventional terrestrial transportation.
References
| ↑1 | IPCC Web Site |
|---|---|
| ↑2 | Our World In Data |
| ↑3 | Lee, D. S., Fahey, D. W., Skowron, A., Allen, M. R., Burkhardt, U., Chen, Q., … & Gettelman, A. (2020). The contribution of global aviation to anthropogenic climate forcing for 2000 to 2018. Atmospheric Environment, 117834. |
| ↑4 | Sausen, R., & Schumann, U. (2000). Estimates of the climate response to aircraft CO2 and NOx emissions scenarios. Climatic Change, 44(1-2), 27-58. The Global Carbon Budget estimated total CO2 emissions from all fossil fuels, cement production and land-use change to be 42.1 billion tonnes in 2018. This means aviation accounted for [1 / 42.1 * 100] = 2.5% of total emissions. |
| ↑5 | Global Carbon Project. (2019). Supplemental data of Global Carbon Budget 2019 (Version 1.0) [Data set]. Global Carbon Project. https://doi.org/10.18160/gcp-2019. If we were to exclude land use change emissions, aviation accounted for 2.8% of fossil fuel emissions. The Global Carbon Budget estimated total CO2 emissions from fossil fuels and cement production to be 36.6 billion tonnes in 2018. This means aviation accounted for [1 / 36.6 * 100] = 2.8% of total emissions. 2.3% to 2.8% of emissions if land use is excluded. |
| ↑6 | Lee, D. S., Fahey, D. W., Skowron, A., Allen, M. R., Burkhardt, U., Chen, Q., … & Gettelman, A. (2020). The contribution of global aviation to anthropogenic climate forcing for 2000 to 2018. Atmospheric Environment, 117834. |
| ↑7 | Graver, B., Zhang, K., & Rutherford, D. (2019). CO2 emissions from commercial aviation, 2018. The International Council of Clean Transportation. |
| ↑8 | Becken, S. and P. Pant (2019). Airline initiatives to reduce climate impact: ways to accelerate action (White paper) |
| ↑9 | Airline traffic data comes from the International Civil Aviation Organization (ICAO) via Airlines for America. Revenue passenger kilometers (RPK) measures the number of paying passengers multiplied by their distance traveled. |


